How Earth observations transformed land monitoring over 20 years
Satellite Earth observations have been around since the 1970s, but turning them into reliable land monitoring services has long been hindered by data gaps, evolving algorithms and shifting policy needs.
But all that has changed over the past two decades.
Twenty years ago, I was managing national land cover mapping projects in the UK that struggled to get complete image coverage during, or even close to, the reference year they were supposed to represent.
There was a lack of Earth observation data at this time, particularly from optical satellite systems that could record detail at field and city block scales over large areas. They only acquired images of each point on the surface every few weeks at best. These acquisition frequencies were reduced further when cloud contamination and natural landscape cycles were considered.
It took years to compile suitable and comprehensive image coverages for a viable area of interest. For instance, the UK Land Cover Map 2000 took four years to acquire the bare minimum of the required data and still only reached 99% completion.
From data scarcity to data deluge
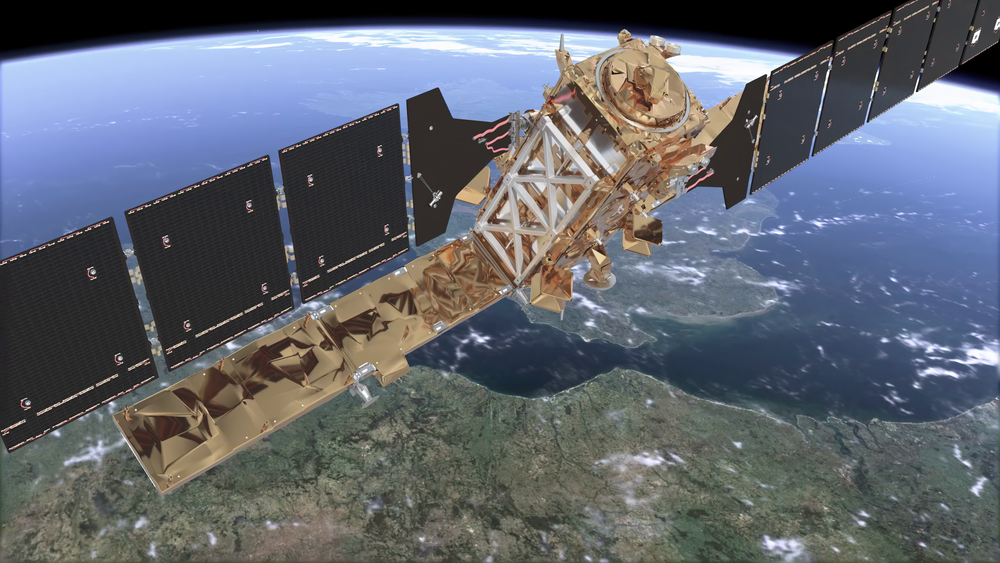
With the Copernicus Sentinel satellites (especially Sentinel-1 and 2), harmonisation with US Landsat and the rise of commercial imaging constellations, we’re now flooded with satellite images. This wealth of data now makes it possible to produce annual land cover maps using rich time series, instead of relying on the limited dual-season snapshots of the past.
We have swapped the challenge of data scarcity with the challenge of dealing with a data deluge! In many ways this is a positive change, as we can now guarantee sufficient data in our reference periods. But it also raises questions about how we can and should characterise landscapes with these rich time series.
This highlights the limitations of conventional hard classification approaches, which give a single label for an area, and the opportunities of being able to map multiple landscape characteristics and processes such as vegetation phenology, management practices and episodic events like floods.
So, the advances over the last 20 years must also be accompanied by paradigm shifts in how we monitor landscapes and the exploitation of the additional value that can be extracted from available data. This is likely to exceed the impact of moving from paper maps to digital geospatial databases.
There are exciting times ahead.
Image: Sentinel-1/ESA
This blog from Geoff Smith of Specto Natura is part of a series to mark 20 years of the Group on Earth Observations. We are calling on the GEO community to contribute to this series. Choose from one of two themes:
- 20 years of data: How the world has changed. How has data helped us understand global change? Share key datasets, insights and visualisations.
- Then and now. Thoughts and reflections on how Earth observations and GEO have evolved. Where did we begin, where are we now, what’s next?
Blogs should be no more than 400 words, informal but professional, and avoid excessive jargon. Send your ideas, drafts and questions to mcrook.ext@geosec.org