Looking for airport pollution from space
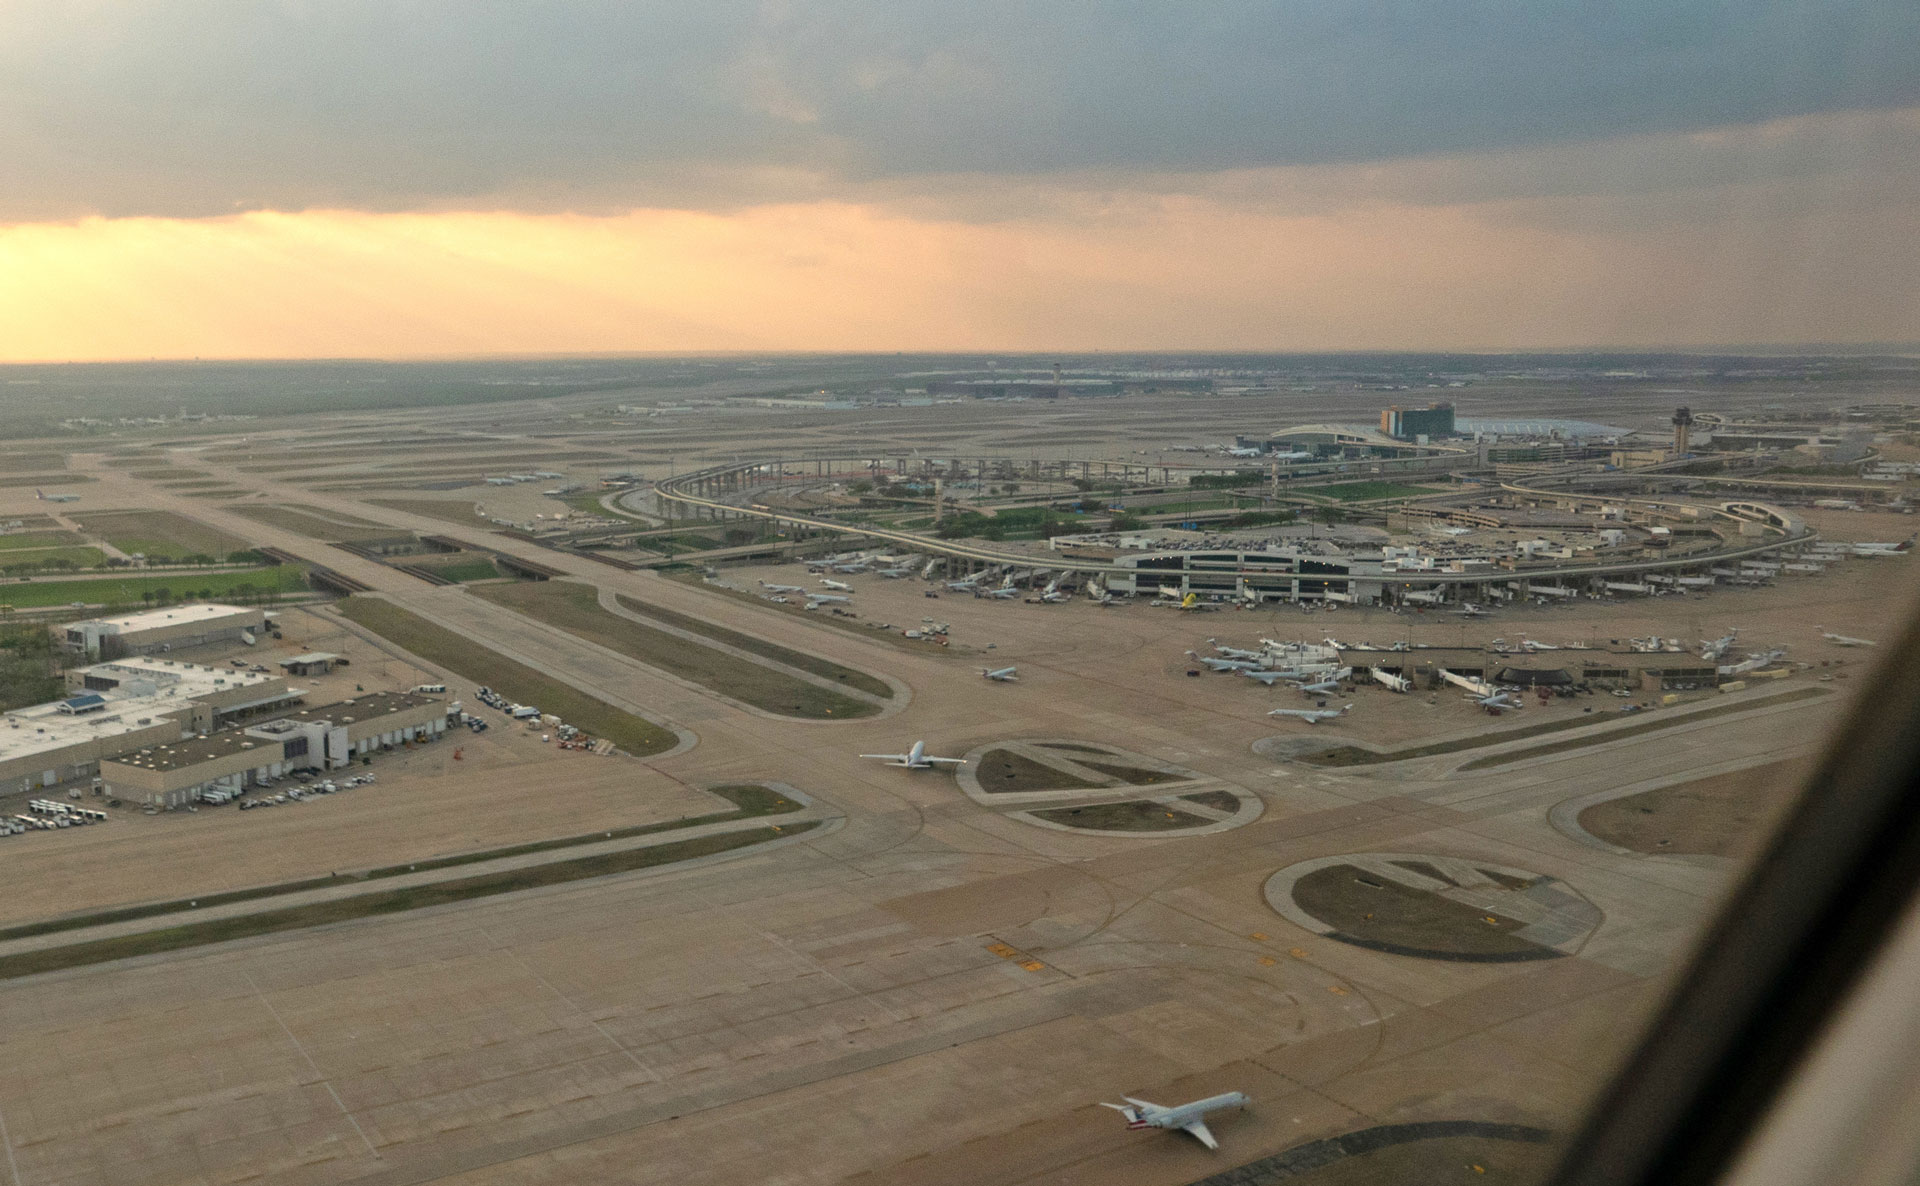
One evening at Chicago O'Hare, Federal Aviation Administration (FAA) records showed one of the airport events I was studying. But when I went looking for the satellite observation to go with it, the closest one came nearly 13 hours later.
I spent time at NASA Langley Research Center working with my mentor, Dr Hazem Mahmoud, to see what Earth observation can tell us about air pollution near airports.
The pollutant I focused on was nitrogen dioxide (NO₂), which is released whenever fuel is burned. NO₂ can irritate lungs and make asthma worse. Airports burn fuel around the clock, in jet engines and in the road traffic going to and from the terminals. I expected to find NO₂ building up during busy periods.
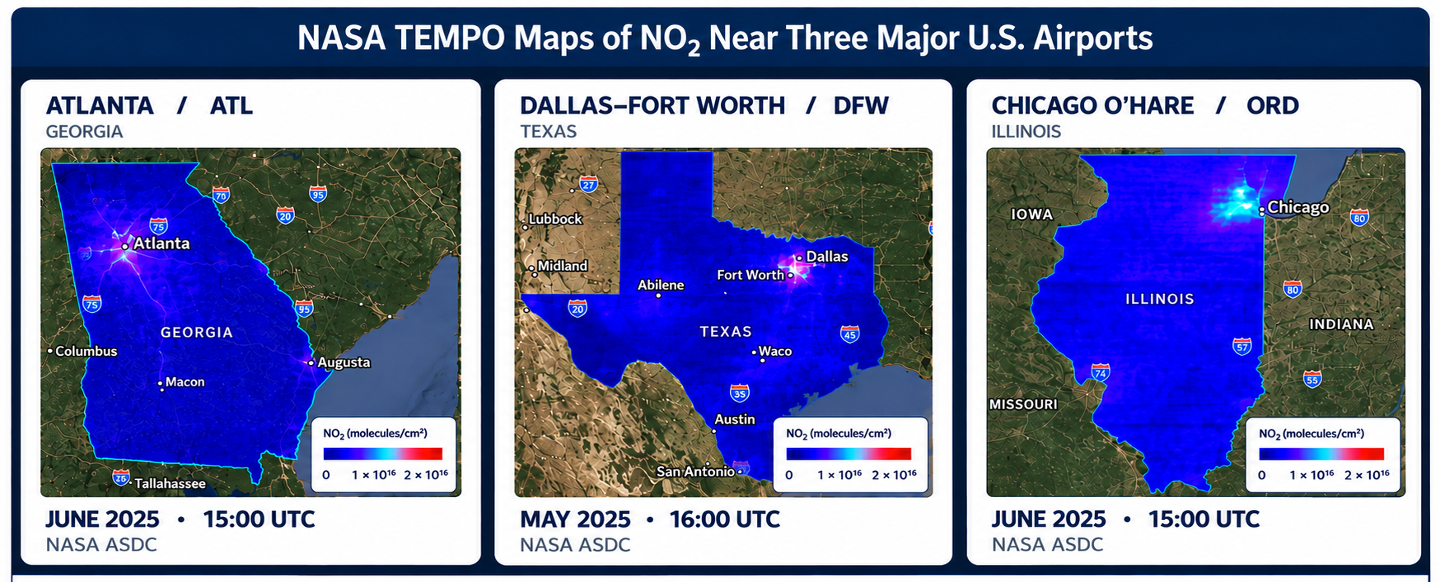
To test this, I used FAA records from August 2023 to March 2026 to pick out periods of unusually high flight activity, delays and cancellations at three high-traffic US airports: Atlanta, Dallas-Fort Worth and Chicago O'Hare.
For the pollution data, I used NASA's Tropospheric Emissions: Monitoring of Pollution instrument, better known as TEMPO. Earlier satellites usually observed a place once a day. TEMPO observes air pollution over North America several times a day, which means you can follow how it changes over the course of a day.
I downloaded TEMPO Level 3 NO₂ data (Version 04) through NASA Earthdata Search, from NASA Langley's Atmospheric Science Data Center, and added wind data from NASA POWER to see how wind speed and direction might affect where pollution travels and how it spreads.
NASA TEMPO visualisation of tropospheric NO₂ over North America, 2 August 2023. Source: NASA Scientific Visualization Studio.
What the data showed
At first there was no clear connection between airport traffic and NO₂. When I removed the lower-quality observations, a connection did appear, but it disappeared after considering the differences between airports.
Chicago O'Hare had higher average NO₂ than Atlanta, and a statistical test showed strong evidence of a difference between the two airports during the events I examined. But overall, my results didn't provide enough evidence to confirm a connection between airport traffic and NO₂ levels.
The analysis also showed three things that affected the results:
The O'Hare event happened in the evening, so an observation 13 hours later couldn't represent it. Each satellite observation has to line up with the time of the event it's being matched to.
Small differences in the coordinates I used for each airport changed the NO₂ measurements for 37 of the events.
Pollution near airports may also come from nearby roads, industries and surrounding cities, not just aircraft.
Beyond North America
This approach could be useful to researchers in other parts of the world who want to study NO₂ near airports using instruments like Europe's Sentinel-4 satellite. They could check whether satellite measurements match the time and location of airport events.
My analysis focused only on periods of unusually high airport activity. Future studies could include everyday airport activity, to better understand how NO₂ levels change over time.
Closing thoughts
I started with what seemed a simple question. When an airport gets unusually busy, can we see it in the air above it? I haven’t answered this yet, but I know how I’d try next. I’d compare each airport with itself, matching observations from busy periods with ordinary days at similar times and in similar winds. The data is there, but the trick is catching it at the right moment.